
Ok, I am not buying a car. But I have been keeping my eyes on the prices and check the classifieds weekly. I plan on sticking to the one car plan for Princess, Beauty and I for the fall. However, if Gymnast moves back, that plan may have to change…maybe. As a result, I’m keeping my eyes open and ears to the ground.
I’ve now got $5,000 saved, tentatively ear marked car, just in case. But I truly do not want to buy another car. Not only because my insurance will go up. But more because the logistics of parking at our house with anything more than 2 cars is a PITA especially with 5 people with varying schedules. And when Sea Cadet gets back, we will have 3 cars until he moves out. So adding another car would…oh, I just don’t want to think about it.
Cars and the Pandemic
But I did hear something today that I had not considered…
While a client was here this weekend as I fixed his computer, we got to talking about kids and driving and so on. It has dawned on me recently that we will double drivers in the next 12 months. Princess just got her license. Gymnast just got his permit. Beauty can get her license in December. So all 6 of us will be driving. That was quick!
Anyways, I was telling him my thoughts on adding another car. And Gymnast was chiming in because he is frustrated that I let Princess take the car when she works and to volleyball, etc. so he doesn’t get to drive as often as he wants. And this client called up a local used dealer he knows just to test the waters.
Limited Cars, Higher Cost
He got the owner on the phone with over 20 years experience in the used car business and what he had to say surprised me. It makes sense but I hadn’t thought of it…the pandemic has caused two types of crisis in the auto industry (I’m sure there are more, but these are the ones he brought up.)
Auto manufacturers have pretty much shut down. Between the quarantines and the loss of income to American workers, there’s just not the demand for car.
Banks suspended repossessions, at least until June or July 1st here in Georgia, which I suppose the used car business relies on.
Between those two factors, the cost of a used car is now that of retail car. Not sure those are the right words…the example he gave is what used to be a $2,000 used car would now sell for $4,900. And for a decent used car, the dealer would now have to pay $10,000 but the bank would come back with a too high if they sold it for $11,500, so no financing available.
I’m not sure I explained that right, but the point of the matter is there is 1) a scarcity of cars to be had (not like the toilet paper issue) and 2) the price of those cars is higher than it should be.
Not a Need
I am so grateful that another car is a want and not a need for us. And I’m doubly grateful that for the first time EVER in my life, I have the money to pay cash for a decent used car. Well, it would have been a decent budget until the virus showed up.
For those that have followed me for a while, yes, the little’s dad has consistent said he was going to provide a car for Princess. And I have called him twice over the summer just seeing if he was still doing that or if he had made any headway. Needless to say, nothing there. This is why I have prepared…just in case.
The post Buying a Car during a Pandemic appeared first on Blogging Away Debt.
Original Source: bloggingawaydebt.com
Content
It doesn’t take into consideration non-operating gains or losses suffered by businesses, the impact of financial leverage, and tax factors. It is calculated as the difference between Gross Profit and Operating Expenses of the business. A company’s common equity is what common shareholders own after all liabilities and preference shares have been settled from total assets. The receivables turnover ratio helps companies measure how quickly they turn customers’ invoices into cash.

Financial ratios depict relationships between accounts and line items in your financial statements, such as assets compared to liabilities or total debt compared to owners’ equity. The current ratio is calculated by dividing current assets by current liabilities. It measures the ability of a company to cover its short-term liabilities with its short-term, or current, assets. The first step in performing a financial ratio analysis is getting the latest copy of the financial statements. If you’re using QuickBooks Online, you can quickly generate an income statement and balance sheet. Then, you have to create a spreadsheet where you can enter the ratio formula and the data. Once you’re done entering the values, all you need to do is analyze the amounts and interpret them concerning the company’s performance.
The average RoE of top Indian companies varies between 14 – 16% to give you a perspective. I personally prefer to invest in companies that have an RoE of 18% upwards. Common financial ratios come from a company’s balance sheet, income statement, and cash flow Financial Ratio Analysis statement. Financial ratios compare the results in different line items of the financial statements. The analysis of these ratios is designed to draw conclusions regarding the financial performance, liquidity, leverage, and asset usage of a business.
Financial leverage ratios provide an indication of the long-term solvency of the firm. Unlike liquidity ratios that are concerned with short-term assets and liabilities, financial leverage ratios measure the extent to which the firm is using long term debt. Asset turnover ratios indicate of how efficiently the firm utilizes its assets. They sometimes are referred to as efficiency ratios, asset utilization ratios, or asset management ratios. Two commonly used asset turnover ratios are receivables turnover and inventory turnover. The “days cash on hand” ratio measures the number of days of expenses that could be paid from existing cash and cash equivalents. Depreciation is removed from total expenses since it does not require a cash outlay.
A common misunderstanding about not-for-profits is that operating surpluses (i.e., savings) are undesirable. In most not-for-profits, accounting surpluses are necessary if equipment and facilities are to be enhanced, debt retired, or liquidity maintained. Understanding financial statements and their data is crucial for all the stakeholders within a company.
It is generally used to determine the likely prospects of different investment options. They should be viewed as indicators, with several of them combined to paint a picture of the firm’s situation.
Many factors cannot be measured by statistics, for example, strategic vision, staff morale and ethical/environmental stance are not easily quantifiable. If total dividends are £70,000 and there are 50 shares, then DPS is £1,400. It means that out of every £100 worth of capital employed, £33.3 has come in the form of loans. If net profit is £300,000 and the revenue is £330,000, then NPM is 91%. Drawing a conclusion – thinking about any necessary steps which need to be taken in order to improve a company’s performance. To simplify the information in the accounts, for example, 37% is easier to understand than 110 out of 295. 3.What impact does microinsurance have on the health of the target populations?
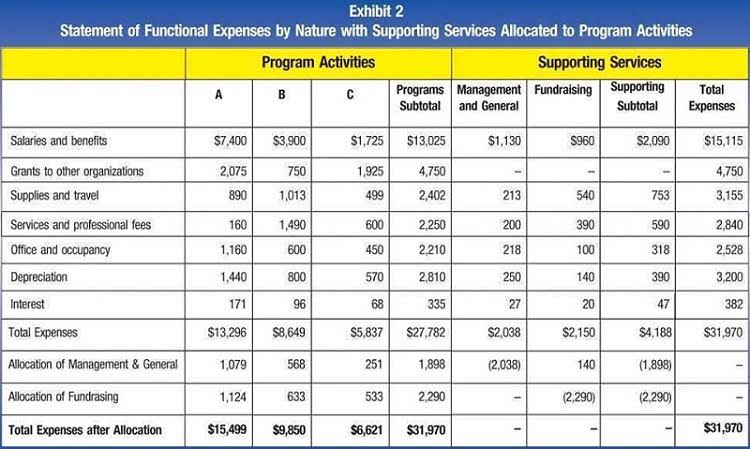
During the past four years, the selected YMCA has consistently maintained a cash balance of approximately 2½ months of spending and an overall liquid net asset balance of approximately 3½ months. The next three ratios all measure a given category of expense as a percentage of total expenses. Conventional wisdom is that expenses incurred for program services are good, while expenses https://www.bookstime.com/ incurred for management and fundraising are undesirable. Because accounting standards require expenses to be classified with the categories of program, fundraising, and management and general, the three ratios must sum to 100% for any given organization. Non-financial data is the measurement of business performance using metrics that are not related to a business’s finances.
Financial ratios can help companies assess their overall performance. It can be sometimes misleading due to controllable and uncontrollable factors affecting the business. But as a small business owner, knowing how to use ratio analysis can help you monitor your business and make guided decisions. That’s why profitability ratios are paired with performance ratios. It’s rare to see poor performance ratios and excellent profitability or vice-versa. Often, these two groups of ratios have a cause-and-effect relationship.
Such ‘hardship financing’ can be more costly than the healthcare and can throw the sick into poverty. Therefore a more appropriate impact indicator might be the extent to which health microinsurance reduces the frequency or intensity of hardship financing. Studies using this alternative indicator are yet to be carried out. Performance ratios depict the company’s ability to convert resources into revenues. More specifically, it’s also how efficiently the company uses its assets to generate revenues. The ultimate goal here is to generate the highest return with the least resource consumption. The first category of financial ratios pertain to the risks of doing business.
This is an important measure for shareholders to anticipate what kind of return they might receive on their investment. Again, this is a ratio that must be compared to others in your industry to be meaningful. In general, a low ratio may indicate an inefficient use of working capital; that is, you could be doing more with your resources, such as investing in equipment. A high ratio can be dangerous, since a drop in sales which causes a serious cash shortage could leave your company vulnerable to creditors.
Keeping this in perspective, if I were to calculate the asset turnover ratio, which asset value should I consider for the denominator? Should I consider the asset value at the beginning of the year or the asset value at the end of the year? To avoid confusion, the practice is to take an average of the two financial years’ asset values. A typical financial ratio utilizes data from the financial statement to compute its value. Before we start understanding the financial ratios, we need to be aware of certain financial ratios’ attributes. Net Working CapitalThe Net Working Capital is the difference between the total current assets and total current liabilities. A positive net working capital indicates that a company has a large number of assets, while a negative one indicates that the company has a large number of liabilities.
During the financial year , the company has acquired some more assets which, when added to the previous year’s assets totalled to Rs.2139 Crs. Clearly, the company started the financial year with a certain rupee value of assets but closed the year with a totally different rupee value of assets.
The firm’s balance sheet contains current assets of $200,000 and current liabilities of $400,000, as well as a debt level that is three times higher than its equity, and a reported net profit ratio of 1%. Based on the applicant’s minimal profitability, excessive degree of leverage and poor current ratio, the analyst decides not to extend trade credit to the customer. The quick or acid test ratio measures how current assets can be converted quickly into cash. The turnover ratios measure the efficiency or speed with which firms turns accounts receivables into cash or inventory to sales. The calculation of accounts receivable period, accounts payable period, and inventory turnover period helps in the estimation of the amount of financing required to fund the working capital needs of the firm. Measure risk in the context of risk of default and the capacity of the firm to meet its obligations at a certain period of time.
In general, the current ratio tell how well a firm can cover its current liabilities with its current assets. The quick ratio is similar to the current ratio but is the current assets minus inventory divided by current liabilities. The quick ratio is primarily used to analyze a firm that relies heavily on selling of inventory to pay current liabilities. Financial statement ratios are calculated using the financial statement of a company to analyze and assess a company. Some financial statement ratios, or financial ratios, may be referred to as balance sheet ratios, income statement ratios, business ratios, or accounting ratios. The numbers used in the computations are often taken from the balance sheet, income statement, and cash flow statement – all publicly available documents – to measure liquidity, leverage, and more.
Higher the interest coverage ratio, higher would be the capacity of the firm to cover the interest payments from earnings. Debt ratios like debt to capital ratio and debt to equity relate debt to total capital or equity of the firm. Community Forest is a scheme that aims to empower local communities and provide access to manage protected or production forest areas. The pine sap commodity is one of the sources of livelihood for the community by utilizing existing access. Financial ratio analysis is very important to determine the value added of marketing margins and profit margins from the pine sap commodities that have been turned into a product. Respondents were selected based on people who worked as pine sap collectors, from farmers to the pine sap processing industry who bought and processed the pine sap products. Liquidity ratios measure your company’s ability to cover its expenses.

Making judgments – analyzing the ratios and stating whether financial performance is satisfactory or needs improvement. This page is probably most useful page for investors to get historical financials. For instance, some U.S. companies use LIFO to assign costs to its inventory and cost of goods sold, while some use FIFO. Some companies will be more conservative when estimating the useful life of equipment, when recording an expenditure as an expense rather than as an asset, and more. The number of times a company has paid creditors and suppliers during a period. Also called average collection period, this metric is the length of time in collecting receivables from customers. The number of times a company has granted and collected credit from customers during a period.
The Leverage ratios also referred to as solvency ratios/ gearing ratios measures the company’s ability to sustain its day to day operations. Leverage ratios measure the extent to which the company uses the debt to finance growth. Remember for the company to sustain its operations, it has to pay its bills and obligations.
Several factors influence the desired level of financial liquidity. Larger organizations and those with more predictable expenses and more diverse revenue sources may maintain lower levels. In addition, organizations relying on donated goods, such as food banks, can operate with lower levels of liquidity since those goods are the source of the bulk of their average monthly expenses. As is the case with many financial ratios, maximizing either of these ratios comes at a cost. While reserves in the form or cash or short-term investments may make the organization financially secure, these resources could also be used in programs that further the organization’s mission. Ratio analysis is the practice of analysing different aspects of financial information found within the company’s financial statements.
The cash ratio measures the ability of the company to pay for its short-term liabilities using only cash and cash equivalents. It is calculated by dividing cash and cash equivalents by current liabilities. Values used in calculating financial ratios are taken from the balance sheet, income statement, statement of cash flows or the statement of changes in equity. These comprise the firm’s “accounting statements” or financial statements. The statements’ data is based on the accounting method and accounting standards used by the organisation.
Financial ratios offer entrepreneurs a way to evaluate their company's performance and compare it other similar businesses in their industry. Ratios measure the relationship between two or more components of financial statements. They are used most effectively when results over several periods are compared.
Each not-for-profit faces unique circumstances, and pursuit of a given strategy may improve one ratio while worsening another. It is also important for boards to understand that resource providers monitor the organization’s ratios.
That along with vertical analysis and horizontal analysis are part of what is known as financial statement analysis. The financial metric “EBITDA” was coined by American billionaire and businessman John C. Malone in the early 1970s. The acronym stands for “earnings before interest, taxes, depreciation, and amortization.” In other words, it’s like adding back deductions for interest, taxes, depreciation, and amortization to operating income. EBITDA depicts true operating profitability since it’s income before non-operating expenses. EBITDA coverage can provide a more accurate picture of servicing debts than the debt coverage ratio. For example, using the previous examples with current assets valued at $2 million and current liabilities at $1 million, say inventories are valued at $1 million. This means that the company has enough in its most liquid assets to fully cover its current liabilities.
Route Mobile, a cloud communications service provider, on Tuesday said it had garnered Rs 180 crore from 15 anchor investors ahead of its initial share-sale offer that opens for public subscription on Wednesday.
Goldman Sachs, Franklin Templeton Mutual Fund, SBI Life Insurance, Kuwait Investment Authority, Vantage Equity Fund, Axis Mutual Fund, Macquarie, and SBI Mutual Fund are among the anchor investors, according to information available with stock exchanges.
Route Mobile has finalised allocation of 51,42,856 shares at Rs 350 apiece to 15 anchor investors. Based on the price, the total proceeds would be to the tune of Rs 180 crore, it added.
The company proposes to raise Rs 600 crore through the initial public offer (IPO), which comprises fresh issue of shares worth Rs 240 crore and an offer for sale (OFS) of Rs 360 crore by promoters Y Sandipkumar Gupta and Rajdipkumar Gupta.
A price band of Rs 345-350 apiece per share has been fixed for the IPO that will open on September 9 and conclude on September 11.
The company proposes to utilise the net proceeds towards funding for repayment or pre-payment, in full or part, of certain borrowings of the company; acquisitions and other strategic initiatives; purchase of office premises in Mumbai; and general corporate purposes.
Image Source: Shutterstock
ALSO READ

Also Read
Happiest Minds Technologies IPO subscribed 8.40 times on the second day of bidding
The company received approval from markets regulator Sebi in December 2019 to float IPO.
The cloud communications service provider had initially filed for its IPO in January 2018. Later it refiled its document in October 2019. According to market sources, the company failed to bring its IPO even after receiving approval in 2018 because of unfavourable market conditions.
ICICI Securities, Axis Capital, Edelweiss Financial Services, and IDBI Capital Markets & Securities are the managers to the issue.
Route Mobile does not have a direct comparable listed peer in India. It will become the second firm in the larger mobile communication services after Affle India.
(Disclaimer: Additional background information has been added to this PTI copy for context)
Want to make your startup journey smooth? YS Education brings a comprehensive Funding Course, where you also get a chance to pitch your business plan to top investors. Click here to know more.
Original Source: yourstory.com